Australia’s Freight Transit: A Complete Analysis Of Transport Methods, Policies And Economic Impacts.
Table of contents
2.Analysis of Australia's freight transit modes
3.Policy framework and regulatory environment
4.Economic impact and industry trends
5.Data charts and case analysis
6.Future prospects and suggestions
As an important logistics hub in the southern hemisphere, Australia's freight transit system is centered on sea transport, supplemented by air transport, road and rail networks, forming an efficient multimodal transport model. In recent years, driven by policy adjustments (such as tariff optimization, environmental protection regulations upgrades) and the needs of economic globalization, Australia's freight industry has shown significant growth, and has had a profound impact on the supply chain structure in the Asia-Pacific region. This article combines the latest data and policy trends to comprehensively analyze its transportation methods, policy frameworks and economic effects.
2.Analysis of Australia's freight transit modes
2.1 Ocean Freight: Cost Advantage and Global Coverage

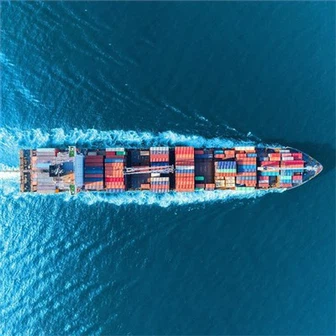
Ocean freight is the backbone of Australia's freight, accounting for about 80% of international trade. Its core advantages are:
Low cost: Taking China to Australia as an example, the first-party freight for LCL by sea freight is about RMB 2,300, and the subsequent freight is as low as RMB 900, which is significantly lower than air freight.
Adaptability of bulk goods: Container transportation can accommodate large goods such as heavy machinery and building materials, and the load capacity of a single container can reach 28 tons.
Wide route coverage: Major ports such as Sydney and Melbourne are directly connected to more than 200 ports around the world, supporting the export of minerals and agricultural products.
Table 1: Comparison of shipping time and cost between major ports in China and Australia (2025 data)
| Port of departure | Destination Port | Time limit (days) | First party cost (yuan) | Renewal cost (yuan) |
| Guangzhou | Melbourne | 20-25 | 2300 | 900 |
| Shanghai | Sydney | 22-28 | 2400 | 950 |
| Qingdao | Brisbane | 25-30 | 2700 | 1000 |
2.2 Air transport: Timeliness and high value-added transportation

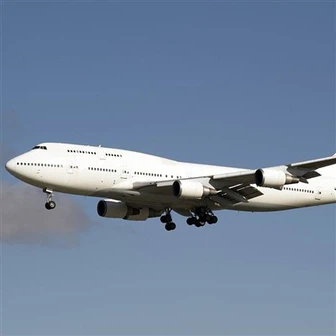
Air transport is known for its timeliness and is suitable for high value-added goods such as electronic products and fresh produce:
Direct routes: Air transport from Hong Kong to Sydney takes only 1-3 days, which is suitable for emergency replenishment of cross-border e-commerce.
Cost disadvantage: The price of air transport is about 3-5 times that of sea transport, but the unit cost can be reduced by warehousing.
2.3 Road and rail: the key to inland extension
Road network: Covering remote areas, cooperating with the "last mile" delivery, such as DHL, UPS and other commercial express delivery to provide door-to-door services.
Rail transport: The cross-continental railway line connecting Perth to Sydney reduces the transportation cost of bulk resources by 15%.
3.Policy framework and regulatory environment
3.1 Tariff policy and tax-free conditions
Australia implements a tiered tariff system for imported goods and provides tax-free channels:
Immigration tax exemption: New immigrants can apply for tax exemption for the first consignment of old goods within five years.
Free trade agreement dividend: Under the China-Australia Free Trade Agreement, 94% of goods enjoy zero tariffs, driving the average annual growth of bilateral trade volume by 8%.
3.2 Environmental regulations and logistics innovation
Mandatory fumigation standards: Goods with solid wood packaging must be fumigated to prevent biological invasion.
Green logistics pilot: Starting from 2024, Sydney Port will pilot hydrogen-powered container trucks, reducing carbon emissions by 40%.
3.3 The driving role of the China-Australia Free Trade Agreement
The agreement will improve the timeliness of cross-border logistics between China and Australia by 20% and reduce costs by 12% by simplifying customs clearance procedures and unifying inspection standards.
4.Economic impact and industry trends
4.1 Direct impact of logistics costs on import and export trade
Corporate strategy adjustment: For every 10% increase in sea freight prices, the proportion of small and medium-sized enterprises turning to rail transportation increases by 7%.
Regional economic linkage: Western Australian iron ore is exported to China through efficient sea transportation, driving local GDP to grow by 3.2% annually.
4.2 The rise of cross-border e-commerce formats
Growth data: In 2024, the scale of Australia's cross-border e-commerce will reach 42 billion Australian dollars, with Chinese goods accounting for 35%.
Logistics service upgrade: Asendia and other companies have launched the "dedicated line + self-collection cabinet" model, shortening the delivery time to 3 days.
4.3 Supply chain stability and regional economic linkage
Risk control: In the global supply chain crisis in 2024, Australia's cargo delay rate is 5% lower than the Asia-Pacific average through a diversified port layout.
5.Data charts and case analysis
Table 2: Australia's major commodity import and export data in 2024
| Commodity categories | Export value (AUD billion) | Import value (AUD billion) | main mod EOF transportation |
| Mineral resources | 3200 | 150 | ocean freight (85%) |
| Agricultural products | 780 | 90 | ocean freight (70%) |
| Electronic products | 120 | 450 | airfreight (60%) |
Case: Export strategy of a Chinese furniture company
Challenge: Solid wood furniture needs fumigation and the shipping cycle is long.
Solution: Use plywood frames instead of solid wood packaging, saving 15% of the cost, and achieve 25-day door-to-door delivery through the China-Australia dedicated line.
6.Future prospects and suggestions
Technology-driven: Promote blockchain technology to digitize ocean bills of lading, and the coverage rate is expected to reach 60% in 2026.
Policy recommendations: Further relax the tax exemption quota for small and medium-sized enterprises to stimulate regional trade growth.
Enterprise response: Deploy overseas warehouses (such as Sydney and Melbourne) and shorten the terminal delivery time to 48 hours.
Conclusion
Australia's freight system is consolidating its position as a global logistics hub through policy optimization and technological innovation. In the future, with the deepening of green transformation and digitalization, China-Australia freight cooperation will move towards higher efficiency and sustainability.